效能分析器
效能分析器是一個強大的開發工具,可提供關於任何請求執行的詳細資訊。
危險
絕對不要在生產環境中啟用效能分析器,因為這會導致專案中出現重大的安全漏洞。
安裝
在使用 Symfony Flex 的應用程式中,請先執行此命令安裝 profiler Symfony 套件。
1
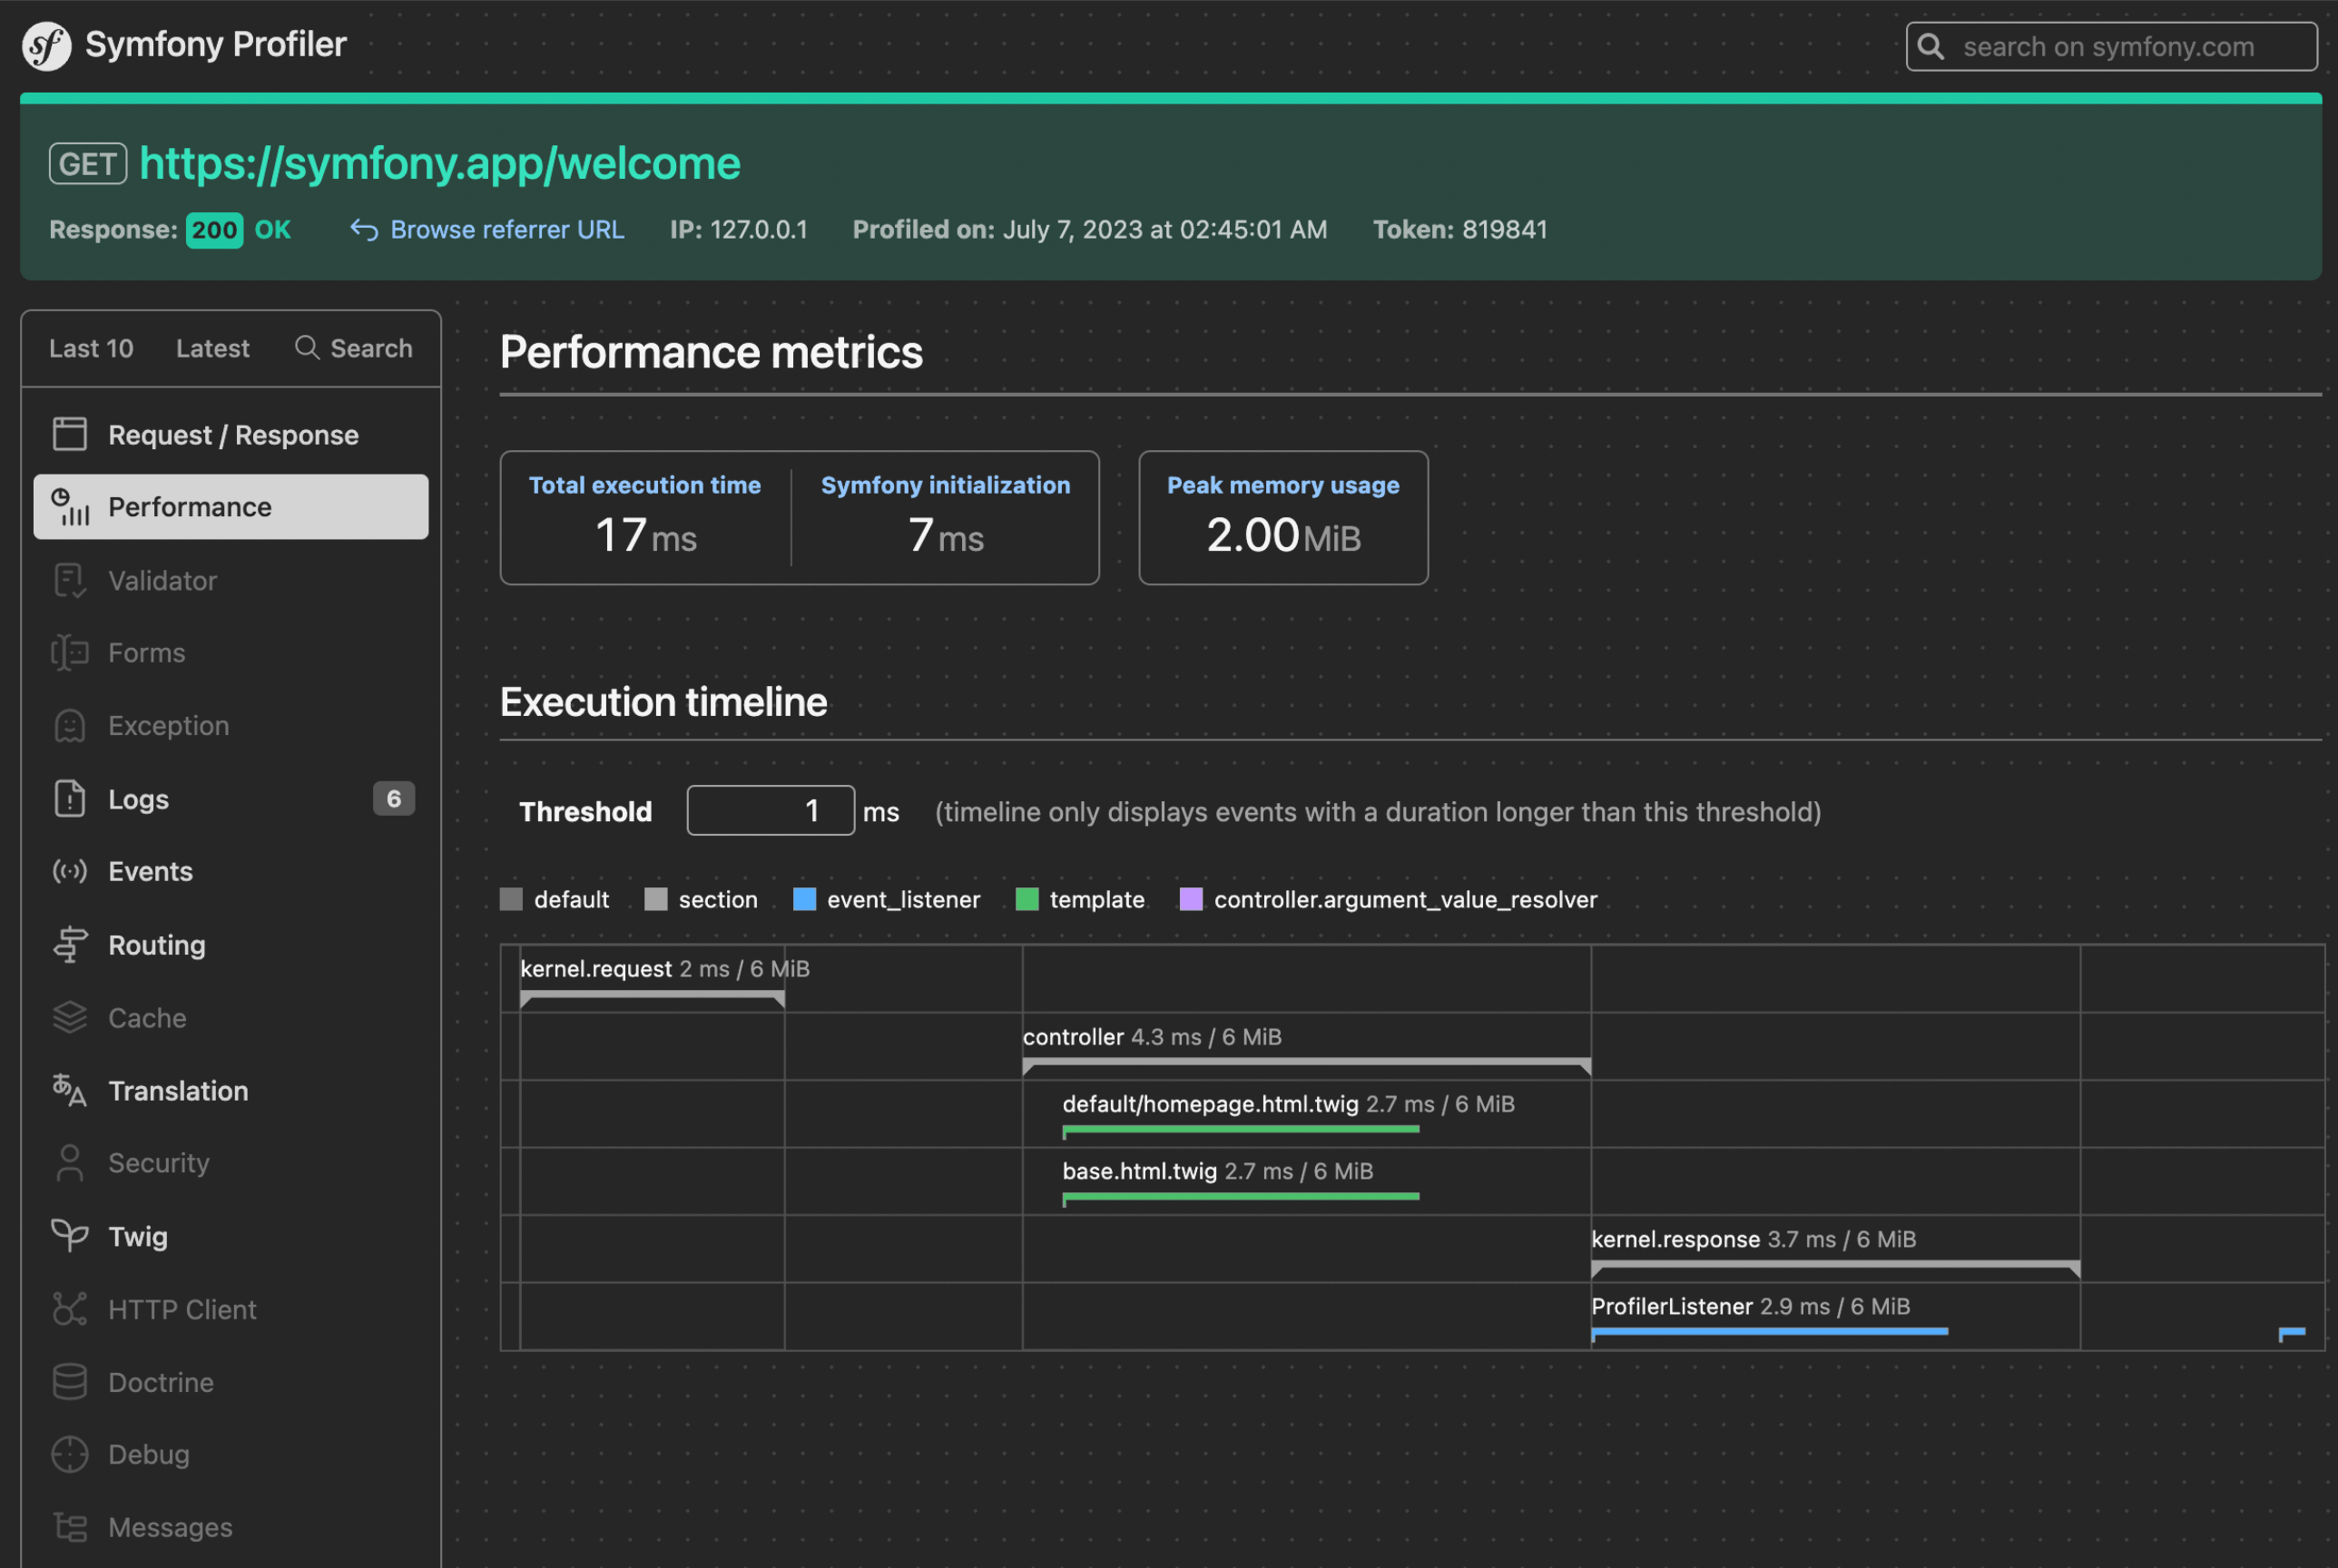
$ composer require --dev symfony/profiler-pack現在,在開發環境中瀏覽應用程式的任何頁面,讓效能分析器收集資訊。然後,點擊注入在頁面底部的除錯工具列的任何元素,以開啟 Symfony 效能分析器的網頁介面,看起來會像這樣
注意
除錯工具列僅注入到 HTML 回應中。對於其他種類的內容(例如 API 請求中的 JSON 回應),效能分析器 URL 位於 X-Debug-Token-Link HTTP 回應標頭中。瀏覽 /_profiler URL 以查看所有效能分析。
注意
為了限制效能分析在磁碟上使用的儲存空間,它們會在 2 天後以機率方式移除。
以程式方式存取效能分析資料
大多數時候,效能分析器資訊是使用其網頁介面存取和分析的。但是,您也可以透過 profiler 服務提供的方法以程式方式檢索效能分析資訊。
當回應物件可用時,使用 loadProfileFromResponse() 方法存取其相關的效能分析。
1
2
// ... $profiler is the 'profiler' service
$profile = $profiler->loadProfileFromResponse($response);當效能分析器儲存關於請求的資料時,它也會將一個令牌與之關聯;此令牌在回應的 X-Debug-Token HTTP 標頭中可用。使用此令牌,您可以透過 loadProfile() 方法存取任何過去回應的效能分析。
1
2
$token = $response->headers->get('X-Debug-Token');
$profile = $profiler->loadProfile($token);
提示
當效能分析器已啟用但網頁除錯工具列未啟用時,請使用瀏覽器的開發人員工具檢查頁面以取得 X-Debug-Token HTTP 標頭的值。
profiler 服務也提供 find() 方法,以根據某些條件尋找令牌。
1
2
3
4
5
6
7
8
9
10
11
12
13
14
// gets the latest 10 tokens
$tokens = $profiler->find('', '', 10, '', '', '');

// gets the latest 10 tokens for all URLs containing /admin/
$tokens = $profiler->find('', '/admin/', 10, '', '', '');

// gets the latest 10 tokens for all URLs not containing /api/
$tokens = $profiler->find('', '!/api/', 10, '', '', '');

// gets the latest 10 tokens for local POST requests
$tokens = $profiler->find('127.0.0.1', '', 10, 'POST', '', '');

// gets the latest 10 tokens for requests that happened between 2 and 4 days ago
$tokens = $profiler->find('', '', 10, '', '4 days ago', '2 days ago');
資料收集器
效能分析器使用一些稱為「資料收集器」的服務來取得資訊。Symfony 內建了幾個收集器,可取得關於請求、記錄器、路由、快取等的資訊。
執行此命令以取得應用程式中實際啟用的收集器列表
1
$ php bin/console debug:container --tag=data_collector您也可以 建立自己的資料收集器,以儲存應用程式產生的任何資料,並在除錯工具列和效能分析器網頁介面中顯示它。
測量應用程式執行時間
如果您想測量應用程式中某些任務所花費的時間,則無需建立自訂資料收集器。相反地,請使用內建工具來 分析 Symfony 應用程式的效能。
提示
考慮使用專業的效能分析器,例如 Blackfire,以詳細測量和分析應用程式的執行。
以程式方式或有條件地啟用效能分析器
Symfony 效能分析器可以透過程式方式啟用和停用。您可以在控制器中使用 Profiler 類別的 enable() 和 disable() 方法,以程式方式管理效能分析器
1
2
3
4
5
6
7
8
9
10
11
12
13
14
15
16
17
18
use Symfony\Component\HttpKernel\Profiler\Profiler;
// ...

class DefaultController
{
    // ...

    public function someMethod(?Profiler $profiler): Response
    {
        // $profiler won't be set if your environment doesn't have the profiler (like prod, by default)
        if (null !== $profiler) {
            // if it exists, disable the profiler for this particular controller action
            $profiler->disable();
        }

        // ...
    }
}
為了讓效能分析器注入到您的控制器中,您需要建立一個指向現有 profiler 服務的別名
1
2
3
# config/services_dev.yaml
services:
Symfony\Component\HttpKernel\Profiler\Profiler: '@profiler'有條件地啟用效能分析器
除了如前一節所述以程式方式啟用效能分析器之外,您也可以在滿足特定條件時啟用它(例如,URL 中包含特定參數)
1 2 3 4 5
# config/packages/dev/web_profiler.yaml
framework:
profiler:
collect: false
collect_parameter: 'profile'此配置預設停用效能分析器 (collect: false) 以改善應用程式效能;但對於包含名為 profile 的查詢參數的請求啟用它(您可以自由選擇此查詢參數名稱)。
除了查詢參數之外,當提交具有該名稱的表單欄位(對於在 POST 請求中啟用效能分析器很有用)或將其作為請求屬性包含時,此功能也有效。
在 AJAX 請求後更新網頁除錯工具列
單頁應用程式 (SPA) 是透過動態重寫當前頁面而不是從伺服器載入整個新頁面來與使用者互動的網頁應用程式。
預設情況下,除錯工具列會顯示初始頁面載入的資訊,並且在每次 AJAX 請求後都不會重新整理。但是,您可以將 Symfony-Debug-Toolbar-Replace 標頭設定為 AJAX 請求回應中的 '1' 值,以強制重新整理工具列
1
$response->headers->set('Symfony-Debug-Toolbar-Replace', '1');理想情況下,此標頭應僅在開發期間設定,而不適用於生產環境。為此,請建立一個 事件訂閱器 並監聽 kernel.response 事件
1 2 3 4 5 6 7 8 9 10 11 12 13 14 15 16 17 18 19 20 21 22 23 24 25 26 27 28 29 30
use Symfony\Component\EventDispatcher\EventSubscriberInterface;
use Symfony\Component\HttpKernel\Event\ResponseEvent;
use Symfony\Component\HttpKernel\KernelInterface;
// ...
class MySubscriber implements EventSubscriberInterface
{
public function __construct(
private KernelInterface $kernel,
) {
}
// ...
public function onKernelResponse(ResponseEvent $event): void
{
if (!$this->kernel->isDebug()) {
return;
}
$request = $event->getRequest();
if (!$request->isXmlHttpRequest()) {
return;
}
$response = $event->getResponse();
$response->headers->set('Symfony-Debug-Toolbar-Replace', '1');
}
}建立資料收集器
Symfony 效能分析器使用一些稱為資料收集器的特殊類別來取得其效能分析和除錯資訊。Symfony 內建了一些,但您也可以建立自己的。
資料收集器是一個 PHP 類別,實作了 DataCollectorInterface。為了方便起見,您的資料收集器也可以從 AbstractDataCollector 類別擴展,該類別實作了介面並提供了一些實用程式和 $this->data 屬性來儲存收集的資訊。
以下範例顯示了一個自訂收集器,用於儲存關於請求的資訊
1 2 3 4 5 6 7 8 9 10 11 12 13 14 15 16 17
// src/DataCollector/RequestCollector.php
namespace App\DataCollector;
use Symfony\Bundle\FrameworkBundle\DataCollector\AbstractDataCollector;
use Symfony\Component\HttpFoundation\Request;
use Symfony\Component\HttpFoundation\Response;
class RequestCollector extends AbstractDataCollector
{
public function collect(Request $request, Response $response, ?\Throwable $exception = null): void
{
$this->data = [
'method' => $request->getMethod(),
'acceptable_content_types' => $request->getAcceptableContentTypes(),
];
}
}以下是您可以在資料收集器類別中定義的方法
- collect() 方法
-
將收集的資料儲存在本機屬性中(如果您從
AbstractDataCollector擴展,則為$this->data)。如果您需要某些服務來收集資料,請將這些服務注入到資料收集器建構子中。警告
collect()方法只會被呼叫一次。它不是用來「收集」資料,而是用來「拾取」您的服務已儲存的資料。警告
由於效能分析器序列化資料收集器實例,因此您不應儲存無法序列化的物件(如 PDO 物件),或者您需要提供自己的
serialize()方法。 - reset() 方法
- 它在請求之間被呼叫,以重設效能分析器的狀態。預設情況下,它只會清空
$this->data內容,但您可以覆寫此方法以進行額外的清理。 - getName() 方法
- 傳回收集器識別符,該識別符在應用程式中必須是唯一的。預設情況下,它傳回資料收集器類別的 FQCN,但您可以覆寫此方法以傳回自訂名稱(例如
app.request_collector)。此值稍後用於存取收集器資訊(請參閱 如何在功能測試中使用效能分析器),因此您可能更喜歡使用簡短字串而不是 FQCN 字串。
collect() 方法在 kernel.response 事件期間被呼叫。如果您需要收集稍後才可用的資料,請實作 LateDataCollectorInterface 並定義 lateCollect() 方法,該方法在效能分析器資料序列化之前(在 kernel.terminate 事件期間)被調用。
注意
如果您使用具有 autoconfigure 的 預設 services.yaml 配置,則 Symfony 將在下次頁面重新整理後開始使用您的資料收集器。否則,請手動啟用資料收集器。
新增網頁效能分析器模板
您的資料收集器收集的資訊可以同時顯示在網頁除錯工具列和網頁效能分析器中。為此,您需要建立一個包含一些特定區塊的 Twig 模板。
首先,在您的資料收集器類別中新增 getTemplate() 方法,以傳回要使用的 Twig 模板的路徑。然後,新增一些 getter 以讓模板存取收集的資訊
1 2 3 4 5 6 7 8 9 10 11 12 13 14 15 16 17 18 19 20 21 22 23 24 25 26 27 28 29 30 31
// src/DataCollector/RequestCollector.php
namespace App\DataCollector;
use Symfony\Bundle\FrameworkBundle\DataCollector\AbstractDataCollector;
use Symfony\Component\VarDumper\Cloner\Data;
class RequestCollector extends AbstractDataCollector
{
// ...
public static function getTemplate(): ?string
{
return 'data_collector/template.html.twig';
}
public function getMethod(): string
{
return $this->data['method'];
}
public function getAcceptableContentTypes(): array
{
return $this->data['acceptable_content_types'];
}
public function getSomeObject(): Data
{
// use the cloneVar() method to dump collected data in the profiler
return $this->cloneVar($this->data['method']);
}
}在最簡單的情況下,您想要在工具列中顯示資訊,而無需提供效能分析器面板。這需要定義 toolbar 區塊並設定兩個名為 icon 和 text 的變數的值
1 2 3 4 5 6 7 8 9 10 11 12 13 14 15 16 17 18 19 20 21 22 23 24 25 26 27 28
{# templates/data_collector/template.html.twig #}
{% extends '@WebProfiler/Profiler/layout.html.twig' %}
{% block toolbar %}
{% set icon %}
{# this is the content displayed as a panel in the toolbar #}
<svg xmlns="http://www.w3.org/2000/svg"> ... </svg>
<span class="sf-toolbar-value">Request</span>
{% endset %}
{% set text %}
{# this is the content displayed when hovering the mouse over
the toolbar panel #}
<div class="sf-toolbar-info-piece">
<b>Method</b>
<span>{{ collector.method }}</span>
</div>
<div class="sf-toolbar-info-piece">
<b>Accepted content type</b>
<span>{{ collector.acceptableContentTypes|join(', ') }}</span>
</div>
{% endset %}
{# the 'link' value set to 'false' means that this panel doesn't
show a section in the web profiler #}
{{ include('@WebProfiler/Profiler/toolbar_item.html.twig', { link: false }) }}
{% endblock %}提示
Symfony 效能分析器圖示是從 Tabler 圖示 中選取的,Tabler 圖示是一個大型且開源的 SVG 圖示集合。建議您也為自己的效能分析器面板使用這些圖示,以獲得一致的外觀。
提示
內建的收集器模板將其所有圖像定義為嵌入式 SVG 檔案。這使得它們可以在任何地方工作,而無需處理網頁資源連結
1 2 3 4
{% set icon %}
{{ include('data_collector/icon.svg') }}
{# ... #}
{% endset %}如果工具列面板包含擴充的網頁效能分析器資訊,則 Twig 模板也必須定義其他區塊
1 2 3 4 5 6 7 8 9 10 11 12 13 14 15 16 17 18 19 20 21 22 23 24 25 26 27 28 29 30 31 32 33 34 35 36 37 38 39 40 41 42 43 44 45 46 47 48 49 50
{# templates/data_collector/template.html.twig #}
{% extends '@WebProfiler/Profiler/layout.html.twig' %}
{% block toolbar %}
{% set icon %}
{# ... #}
{% endset %}
{% set text %}
<div class="sf-toolbar-info-piece">
{# ... #}
</div>
{% endset %}
{{ include('@WebProfiler/Profiler/toolbar_item.html.twig', { 'link': true }) }}
{% endblock %}
{% block head %}
{# Optional. Here you can link to or define your own CSS and JS contents. #}
{# Use {{ parent() }} to extend the default styles instead of overriding them. #}
{% endblock %}
{% block menu %}
{# This left-hand menu appears when using the full-screen profiler. #}
<span class="label">
<span class="icon"><img src="..." alt=""/></span>
<strong>Request</strong>
</span>
{% endblock %}
{% block panel %}
{# Optional, for showing the most details. #}
<h2>Acceptable Content Types</h2>
<table>
<tr>
<th>Content Type</th>
</tr>
{% for type in collector.acceptableContentTypes %}
<tr>
<td>{{ type }}</td>
</tr>
{% endfor %}
{# use the profiler_dump() function to render the contents of dumped objects #}
<tr>
{{ profiler_dump(collector.someObject) }}
</tr>
</table>
{% endblock %}menu 和 panel 區塊是定義與此資料收集器關聯的網頁效能分析器面板中顯示的內容的唯一必要區塊。所有區塊都可以存取 collector 物件。
注意
工具列中每個面板的位置由收集器優先順序決定,該優先順序只能在手動配置資料收集器時定義。
注意
如果您使用具有 autoconfigure 的 預設 services.yaml 配置,則 Symfony 將在下次頁面重新整理後開始在工具列中顯示您的收集器資料。否則,請手動啟用資料收集器。
啟用自訂資料收集器
如果您不使用 Symfony 的預設配置以及 自動連線和自動配置,則需要明確配置資料收集器
1 2 3 4 5 6 7 8 9 10 11 12
# config/services.yaml
services:
    App\DataCollector\RequestCollector:
        tags:
            -
                name: data_collector
                # must match the value returned by the getName() method
                id: 'App\DataCollector\RequestCollector'
                # optional template (it has more priority than the value returned by getTemplate())
                template: 'data_collector/template.html.twig'
                # optional priority (positive or negative integer; default = 0)
                # priority: 300